How to Read a T Table: Understanding Statistical Inference and Using PDFChat for Analysis
What is a T Table?
The T table (T-table) serves as a fundamental tool in statistics, aiding in the computation of the t-statistic. This statistical measure plays a crucial role in determining whether a significant distinction exists between the sample mean and the population mean. By furnishing critical values of the t-statistic across various degrees of freedom and confidence levels, the T table facilitates inference regarding the significance of observed differences.
How to Read a T Table
To navigate the T table effectively, it is imperative to comprehend its essential components and structure. Typically, columns denote the values of the t-statistic, while rows correspond to different degrees of freedom. Each cell within the table houses the critical value of the t-statistic pertinent to the specified degrees of freedom and confidence level.
Key Steps for Reading a T Table:
-
Identify Degrees of Freedom: Recognize the degrees of freedom associated with the sample size, pivotal for hypothesis testing and statistical analysis.
-
Select Confidence Level: Determine the desired confidence level, often expressed as a significance level such as 0.05 or 0.01.
-
Locate Corresponding Row and Column: Navigate to the appropriate row and column intersecting the specified degrees of freedom and confidence level.
-
Find the Critical Value: Extract the critical value from the identified cell, representing the threshold for significance in the t-statistic.
-
Interpret the Result: Contrast the calculated t-statistic with the critical value obtained from the T table to ascertain the significance of observed differences.
Through adherence to these steps, one can harness the power of the T table for robust statistical analysis and inference.
Using PDFChat to Read T Tables
Step 1: Upload the Document
Initiate the analysis process by uploading the PDF document containing the T table to PDFChat. The platform accommodates diverse file formats, ensuring seamless accessibility.

Step 2: Pose Inquiries about the Table
Upon document upload, direct queries pertaining to the desired T table through ChatDOC's intuitive interface.
Tips for Effective Inquiry:
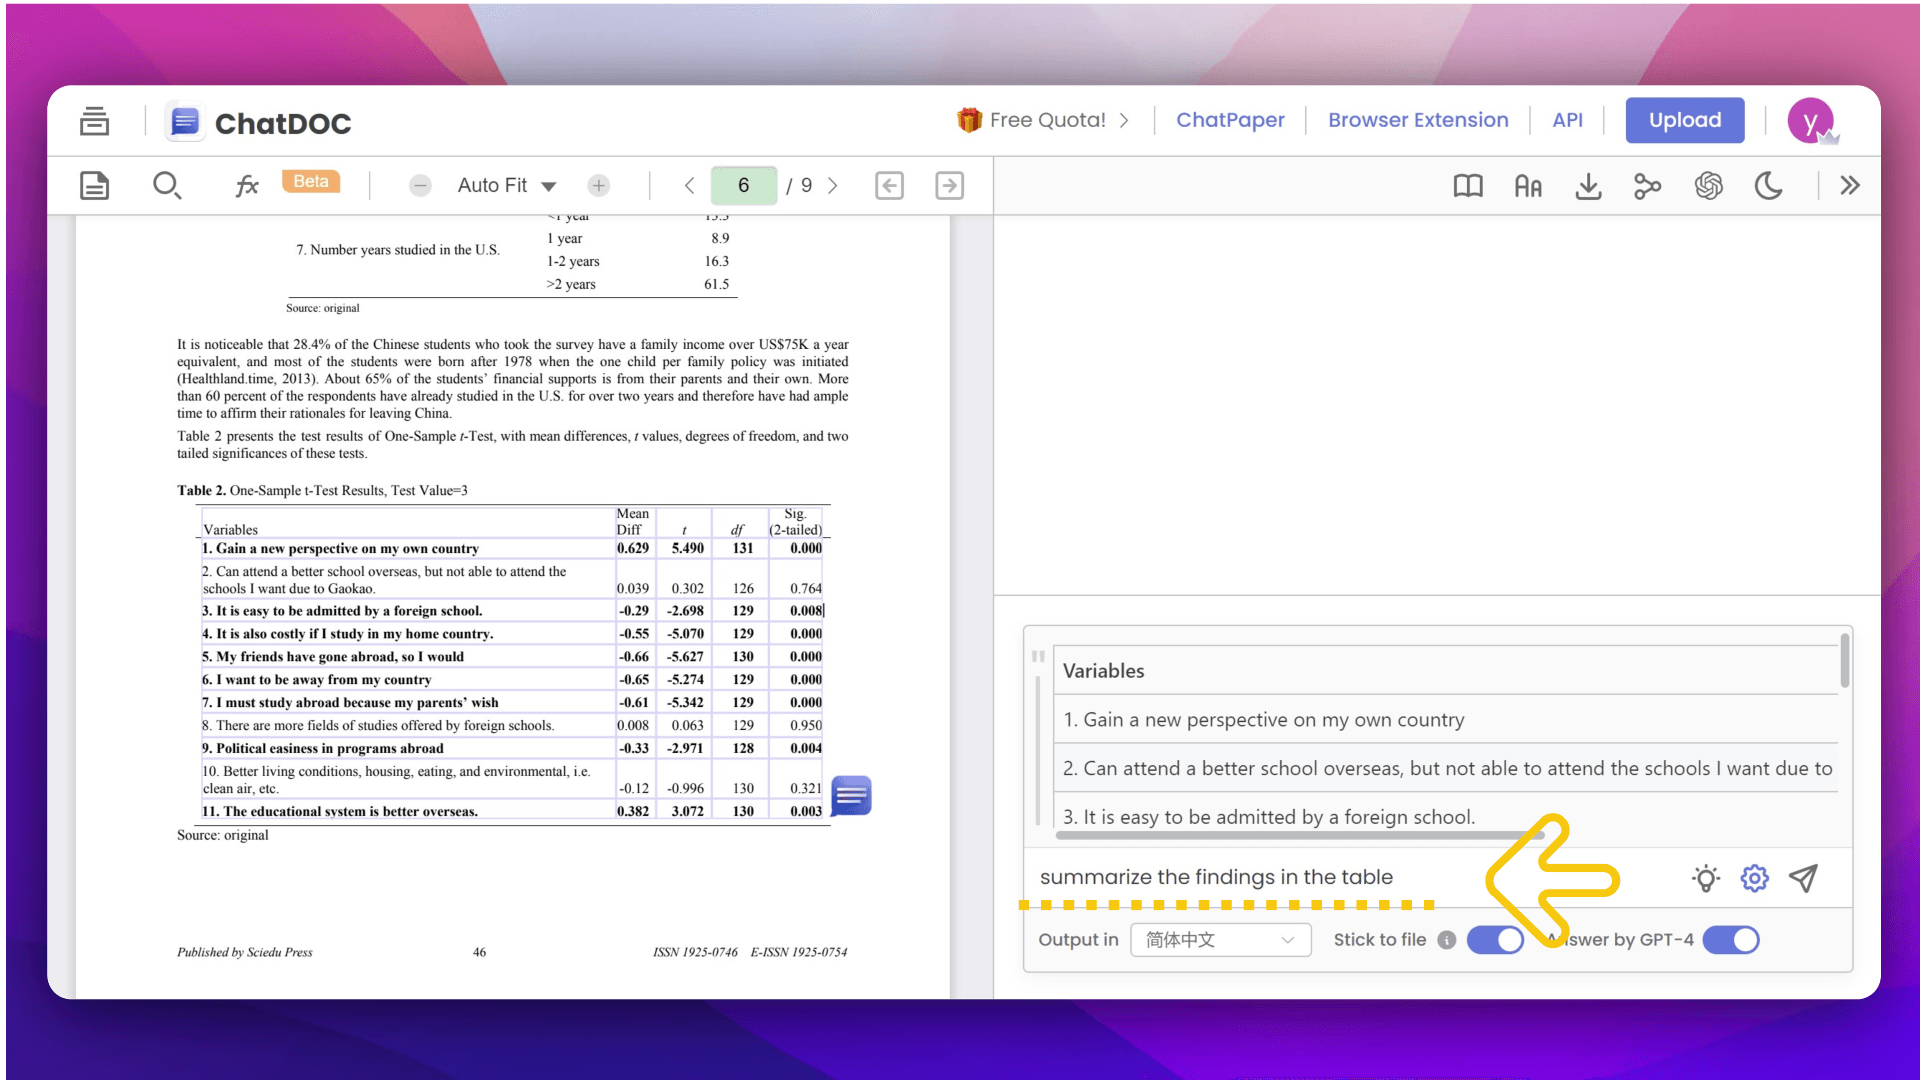
- Generalized Queries: Formulate overarching questions such as "summarize the findings in the table" for comprehensive insights.
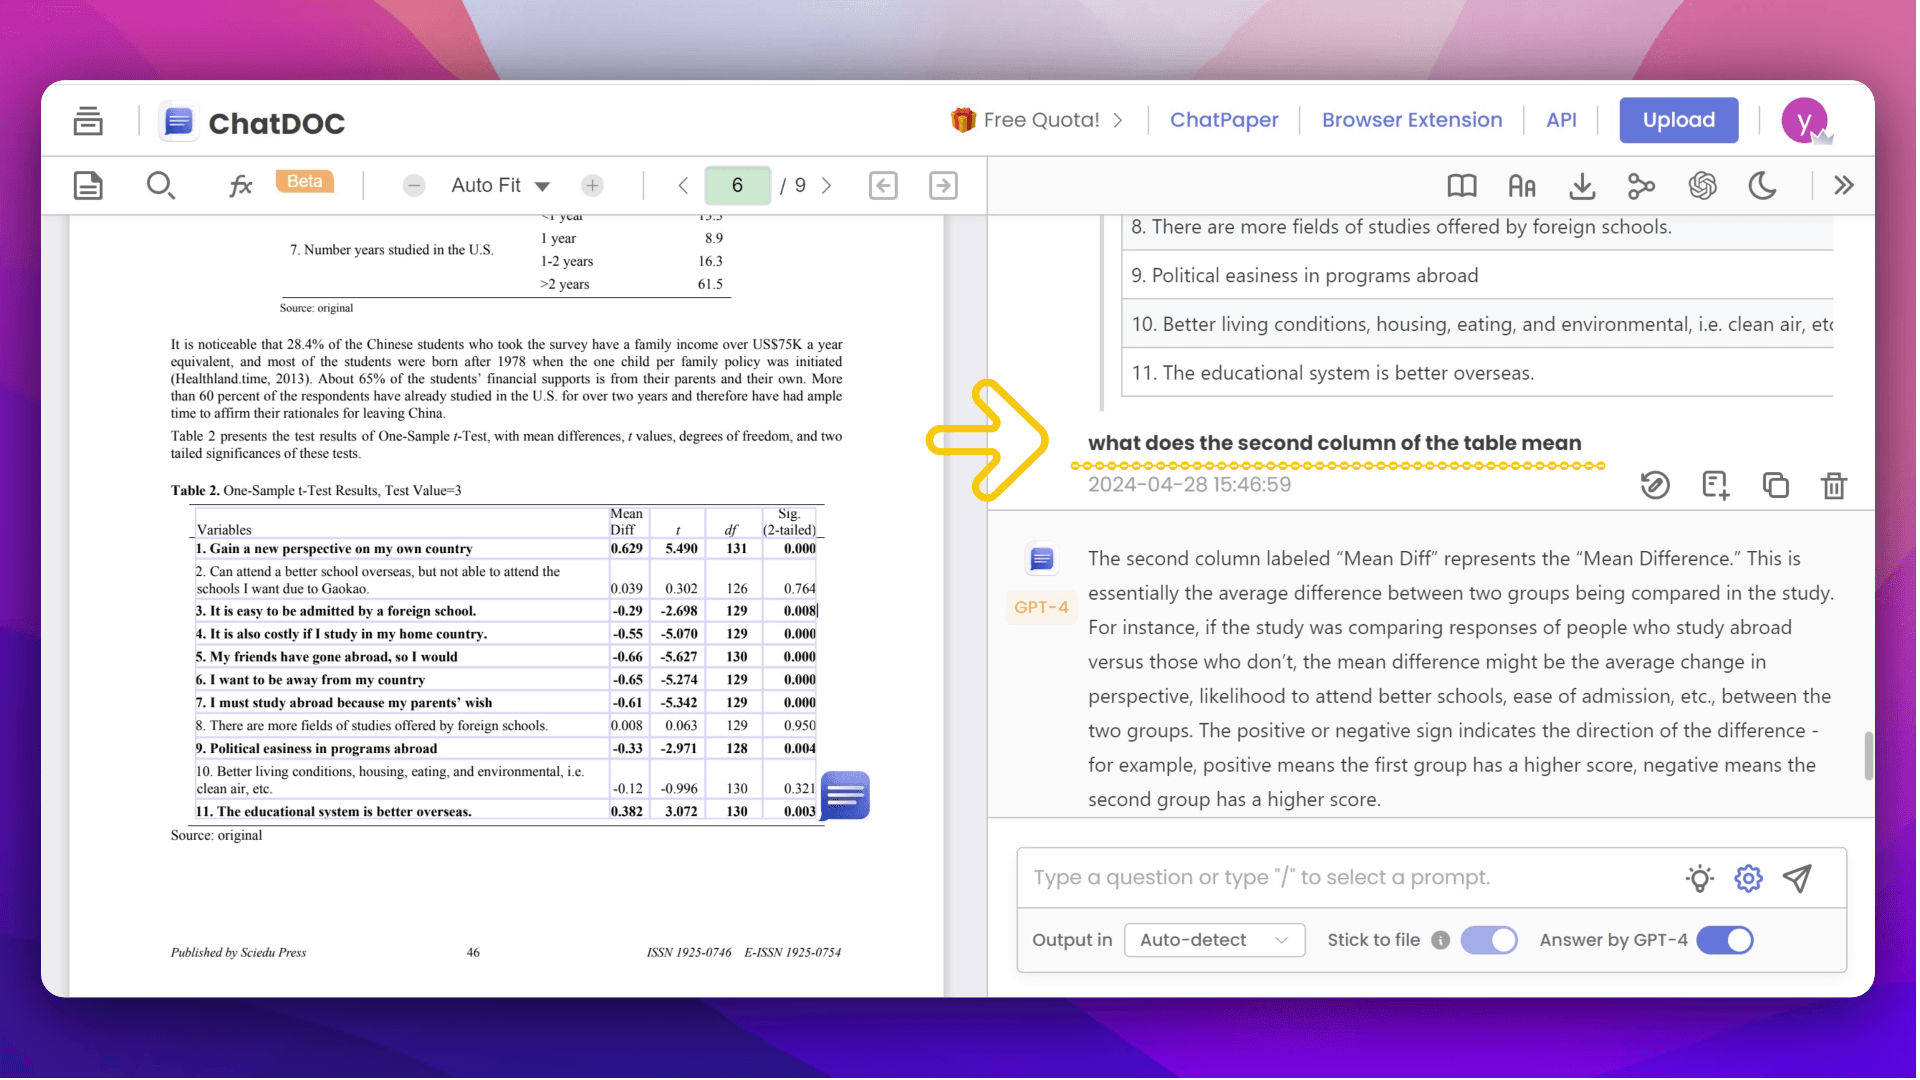
- Specific Inquiries: Target precise numerical aspects by asking focused questions like "what does the second column in the table signify?"
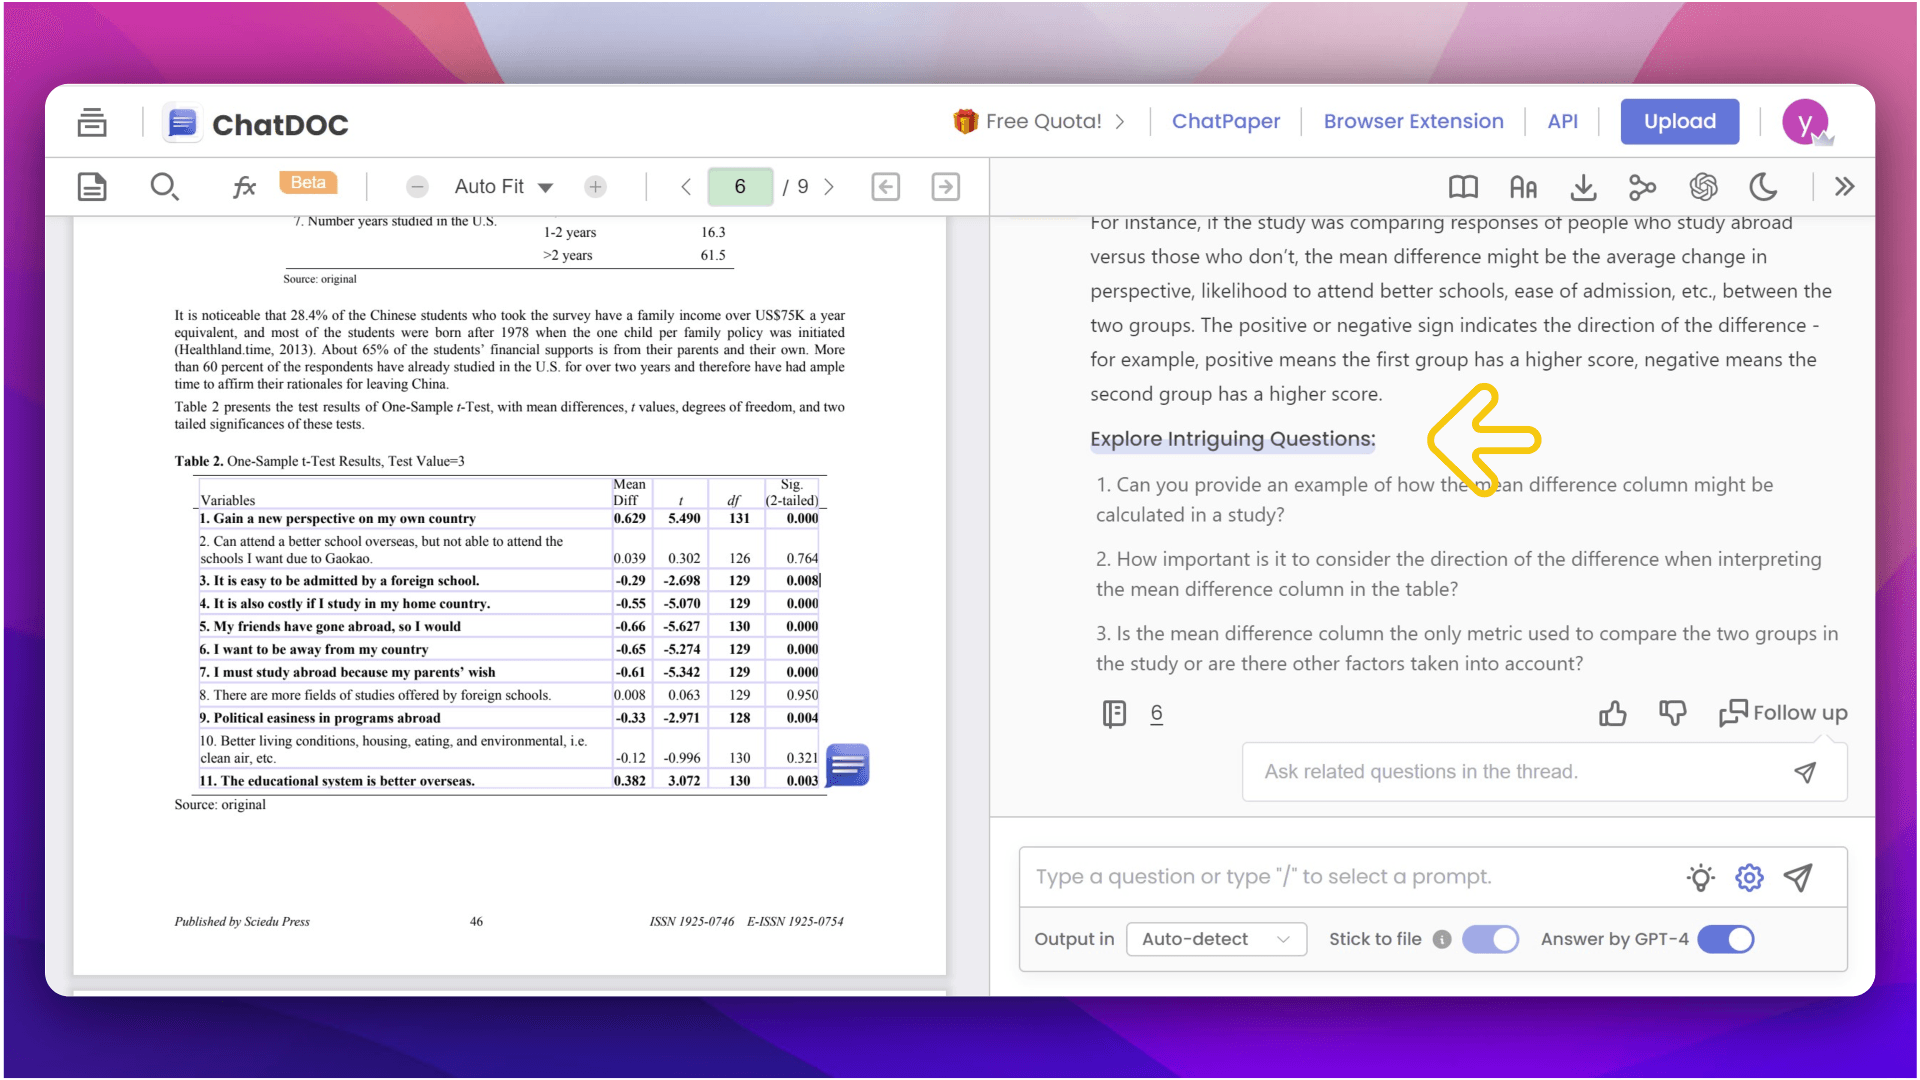
- Exploratory Questions: Engage in deeper data exploration by leveraging intriguing prompts provided by the platform.
By leveraging PDFChat's functionalities, users can unravel the intricacies of T tables and derive valuable insights from their statistical data.
This comprehensive guide elucidates the significance of T tables in statistical analysis and demonstrates their practical utility in hypothesis testing. Through a blend of theoretical understanding and technological innovation, readers can navigate T tables with confidence and proficiency.


Related Articles
How to Read Formulas in PDF: Overcoming Challenges Using PDFChat
With PDFChat, users can effortlessly access explanations and perform calculations, enhancing efficiency and understanding in mathematical document analysis.

Traditional Reading Methods vs. Leveraging AI Technology: How to Summarize a Book
How can we make summarizing a book easier?

How to Use Google to Translate PDF
Learn how to use Google Translate for PDF and discover a new way to go beyond translation